
Statistics
This page contains a number of statistics about personality disorders and related topics. Where available, sources and links to the original data are given and we encourage you to follow the links to these sources if you want to learn more.
Contents:
Personality Disorder Statistics:
Self Harm Statistics:
Abuse Statistics:
Divorce Statistics:
Personality Disorder Statistics
How Common Are Personality Disorders?
A number of studies have been conducted in recent years to determine the prevalence of personality disorders in the general US population.
According to a 2007 study, 9.1% of the US population (about 1 in 11 people) meet the DSM-IV criteria for a personality disorder. Two previous smaller surveys have estimated the percentage between 9.0% and 15.7%.
| Study: | Samuels et al., 2002 | Crawford et al., 2005 | Lenzenweger et al., 2007 |
|---|---|---|---|
| Instrument Used: | IPDE | SCID-II | IPDE |
| Sample Size: | (742) | (644) | (5692) |
| -Paranoid | 0.7% | 5.1% | 2.3% |
| -Schizoid | 0.9% | 1.7% | 4.9% |
| -Schizotypal | 0.6% | 1.1% | 3.3% |
| -Antisocial | 4.1% | 1.2% | 1.0% |
| -Borderline | 0.5% | 3.9% | 1.6% |
| -Histrionic | 0.2% | 0.9% | - |
| -Narcissistic | - | 2.2% | - |
| -Avoidant | 1.8% | 6.4% | 5.2% |
| -Dependent | 0.1% | 0.8% | 0.6% |
| -Obsessive-Compulsive | - | 4.7% | 2.4% |
| PD Unspecified | - | - | 1.6% |
| Any PD | 9.0% | 15.7% | 9.1% |
Sources:
Comorbidity Between Personality Disorders
The following table shows statistically how likely it is that a person who is diagnosed with one personality disorder will also be diagnosed with another personality disorder, as defined by the American Psychiatric Association's Diagnostic & Statistical Manual of Mental Disorders (DSM-IV).
The numbers displayed in the table below are a statistical measures of co-occurrence known as "tetrachoric correlations". The more positive the number, the more likely it is that a person will be diagnosed with the second personality disorder listed. The more negative the number, the less likely it is that a person will be diagnosed with the second personality disorder in the table.
Note: This data was compiled from an initial survey of 5692 people in the US. None of the people in the survey sample were identified as meeting the criteria for Histrionic Personality Disorder or Narcissistic Personality Disorder. Therefore, no comorbidity information is shown for HPD or NPD.
| PPD | SPD | STPD | ASPD | BPD | AVPD | DPD | OCPD | |
| PPD | 0.77 | 0.48 | 0.73 | 0.76 | 0.70 | 0.20 | 0.59 | |
| SPD | 0.77 | 0.96 | -0.84 | 0.56 | 0.55 | -0.84 | 0.40 | |
| STPD | 0.48 | 0.96 | 0.13 | 0.34 | 0.53 | -0.86 | 0.49 | |
| ASPD | 0.73 | -0.84 | 0.13 | 0.64 | 0.05 | -0.83 | 0.45 | |
| BPD | 0.76 | 0.56 | 0.34 | 0.64 | 0.54 | 0.82 | 0.67 | |
| AvPD | 0.70 | 0.55 | 0.53 | 0.05 | 0.54 | 0.70 | 0.63 | |
| DPD | 0.20 | -0.84 | -0.86 | -0.83 | 0.82 | 0.70 | 0.80 | |
| OCPD | 0.59 | 0.40 | 0.49 | 0.45 | 0.67 | 0.63 | 0.80 |
Source: Lenzenweger et al, 2007 - DSM-IV personality disorders in the National Comorbidity Survey Replication
Comorbidity Between Personality Disorders and DSM-IV Axis I Disorders
67% of people who meet the DSM-IV criteria for a Personality DIsorder have been found in a 2007 study to also meet the criteria for at least one of the DSM-IV Axis I disorder. The table below shows the probability that a person who has been diagnosed with a personality disorder will also meet the criteria for each of the following Axis I disorders, as defined by the American Psychiatric Association's Diagnostic & Statistical Manual of Mental Disorders (DSM-IV):
| Axis I Disorder | Comorbidity |
| Anxiety Disorders | 52.4% |
| - Generalized Anxiety Disorder (GAD) | 15.2% |
| - Specific phobia | 23.4% |
| - Social phobia | 26.3% |
| - Panic disorder | 10.0% |
| - Adult separation anxiety disorder (ASAD) | 8.9% |
| - Post Traumatic Stress Disorder (PTSD) | 14.1% |
| Mood Disorders | 24.1% |
| - Major Depressive Disorder (MDD) | 13.4% |
| - Dysthymia | 10.8% |
| - Bipolar I or II | 8.1% |
| Impulse Control Disorders | 23.2% |
| - Intermittent Explosive Disorder (IED) | 15.9% |
| - Attention Deficit Disorder (ADD) | 11.0% |
| Substance Abuse | 22.6% |
| - Alcohol abuse or dependence | 10.9% |
| - Drug abuse or dependence | 5.6% |
| - Tobacco dependence | 11.8% |
| Any DSM-IV Axis I Disorder | 67.0% |
Source: Lenzenweger et al, 2007 - DSM-IV personality disorders in the National Comorbidity Survey Replication
Note that although 67% of the people meeting the criteria for an Axis II - or personality disorder also meet the criteria for an Axis I disorder, the reverse is not true. Only 24.8% of people meeting the criteria for an Axis I disorder also meet the criteria for an Axis II disorder.
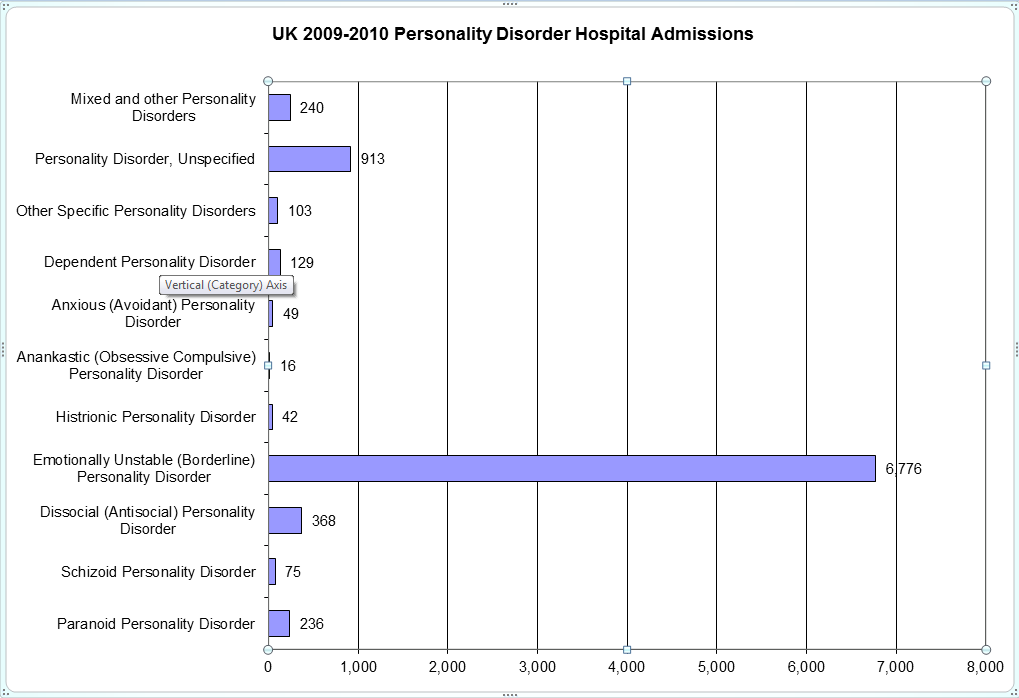
UK 2009-2010 Personality Disorder Hospital Admissions
The chart below gives UK National Health Service 2009-2010 Breakdown of Personality Disorder Diagnoses per hospital admission. Diagnoses are based on the World Health Organization (WHO) International Classification of Diseases (ICD-10).
Click to see Larger Image Copyright © 2010, Re-used with the permission of The Health and Social Care Information Centre. All rights reserved.
Source: UK Department of Health, Hospital Episode Statistics Copyright © 2010, Re-used with the permission of The Health and Social Care Information Centre. All rights reserved.
It can be seen from the chart that a majority (75%) of all hospital admitted personality disorder diagnoses in the UK are for Emotionally Unstable Personality Disorder (EUPD) - which is known internationally as Borderline Personality Disorder (BPD).
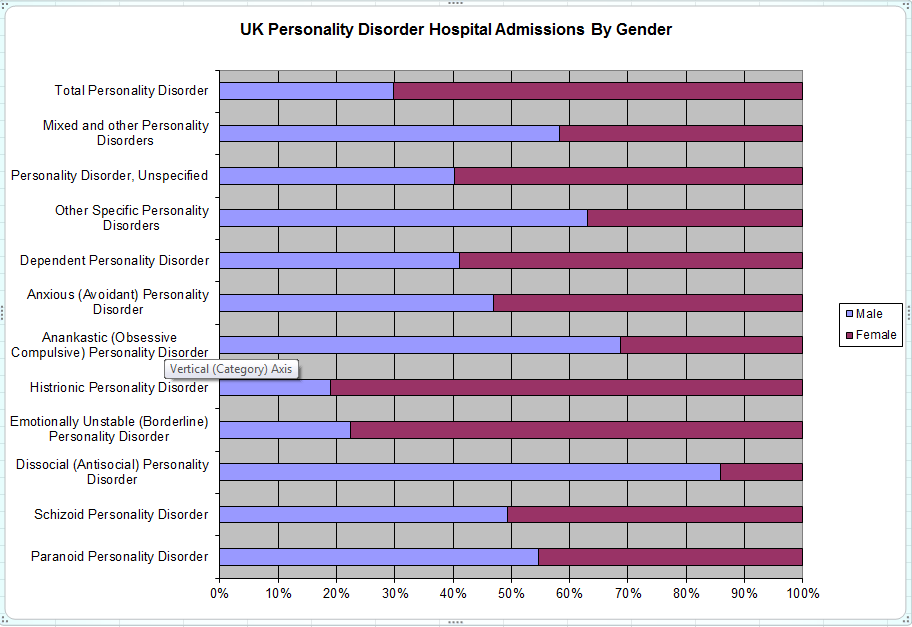
UK 2009-2010 Personality Disorder Hospital Admissions by Gender
The chart below gives UK National Health Service 2009-2010 Breakdown of Personality Disorder Diagnoses by gender per hospital admission. Diagnoses are based on the World Health Organization (WHO) International Classification of Diseases (ICD-10).
Click to see Larger Image Copyright © 2010, Re-used with the permission of The Health and Social Care Information Centre. All rights reserved.
| Primary Diagnosis | Admissions | Male | Female | Male % | Female % |
| Paranoid Personality Disorder | 236 | 129 | 107 | 55% | 45% |
| Schizoid Personality Disorder | 75 | 37 | 38 | 49% | 51% |
| Dissocial (Antisocial) Personality Disorder | 368 | 316 | 52 | 86% | 14% |
| Emotionally Unstable (Borderline) Personality Disorder | 6,776 | 1,515 | 5,261 | 22% | 78% |
| Histrionic Personality Disorder | 42 | 8 | 34 | 19% | 81% |
| Anankastic (Obsessive Compulsive) Personality Disorder | 16 | 11 | 5 | 69% | 31% |
| Anxious (Avoidant) Personality Disorder | 49 | 23 | 26 | 47% | 53% |
| Dependent Personality Disorder | 129 | 53 | 76 | 41% | 59% |
| Other Specific Personality Disorders | 103 | 65 | 38 | 63% | 37% |
| Personality Disorder, Unspecified | 913 | 368 | 545 | 40% | 60% |
| Mixed and other Personality Disorders | 240 | 140 | 100 | 58% | 42% |
| Total Personality Disorder | 8,947 | 2,665 | 6,282 | 30% | 70% |
Source: UK Department of Health, Hospital Episode Statistics Copyright © 2010, Re-used with the permission of The Health and Social Care Information Centre. All rights reserved.
The data shows that about 70% of in-patient personality disorder cases in the UK are diagnosed in females and 30% in males. Borderline and Histrionic Personality Disorders are more commonly diagnosed among females while Antisocial, and Obsessive Compulsive Personality Disorder are more commonly diagnosed among males.
British Medical Journal 2002 Study on Self Harm in Adolescents
A 2002 survey of 15 and 16 year old students in 41 schools in England found that 6.9% reported acts of deliberate self-harm in the previous year, with a significantly higher prevalence in females (11.2%) than in males (3.2%).
| Incidents Reported | Total respondents | (%) | |
| Deliberate self harm: | 398 | 5801 | 6.9% |
Male |
98 | 3078 | 3.2% |
Female |
299 | 2703 | 11.2% |
Gender Unspecified |
1 | 20 | 5.0% |
| Suicidal thoughts(no self harm): | 863 | 5737 | 15.0% |
Male |
258 | 3025 | 8.5% |
Female |
602 | 2692 | 22.4% |
Gender Unspecified |
3 | 20 | 15.0% |
| No self-harm or suicidal thoughts: | 4476 | 5737 | 78.0% |
Male |
2669 | 3025 | 88.2% |
Female |
1791 | 2692 | 66.5% |
Gender Unspecified |
16 | 20 | 80.0% |
12.6% of incidents of self harm resulted in a hospital admission.
Methods used:
| Method | Occurrences | % |
|---|---|---|
| Cutting | 257 | 64.6% |
| Overdose/Poisoning | <122 | 30.7% |
| Other | 19 | 4.8% |
| Total | 379 | 100.0% |
In 2004, suicide was the 11th leading cause of death in the US. There were 32,439 recorded suicides, or 109 suicides for every million people (0.01% of the population). It is estimated that about 25 suicides are attempted for every death recorded.
Gender Distribution:
Women report 3 times as many suicide attempts as men. However, men account for the majority (79.4%) of actual suicide deaths.
Source: Center for Disease Control CDC Suicide FactSheet.
US Suicide Prevalence by Age:
| Demographic Group | 2004 Suicide Rate |
| Children ages 10 to 14 | 1.3 per 100,000 |
| Adolescents ages 15 to 19 | 8.2 per 100,000 |
| Young adults ages 20 to 24 | 12.5 per 100,000 |
| Senior Citizens over age 65 | 14.3 per 100,000 |
| General Population | 10.9 per 100,000 |
Source: National Institute of Mental Health (NIMH).
Methods Used:
| Method | Males % | Females % |
|---|---|---|
| Firearms | 57% | 32% |
| Suffocating | 23% | 20% |
| >Poisoning | 13% | 38% |
| Other | 7% | 10% |
Source: National Institute of Mental Health (NIMH).
Abuse Statistics
In the US, an estimated 903,000 children (1.2% of all children) were victims of abuse and neglect in 2001. 19% of reported and substantiated child abuse cases result in the child being removed from the home.
| Form of Abuse | Percentage |
|---|---|
| Neglect (including medical neglect) | 57.2% |
| Physical Abuse | 18.6% |
| Sexual Abuse | 9.6% |
| Other Maltreatment | 26.6% |
Source: US Department of Health and Human Services Child Maltreatment Report 2001
Percentages of victims are similar for males and females (48.0% and 51.5% respectively).
Children in the age group of birth to 3 years account for 27.7% of victims. Victimization percentages decline as age increases.
| Child Abuse Victims by Ethnicity | Percentage |
|---|---|
| White | 50.2% |
| African-American | 25.0% |
| Hispanic | 14.5% |
| American Indian & Alaska Native | 2.0% |
| Asian Pacific Islander | 1.3% |
Source: US Department of Health and Human Services Child Maltreatment Report 2001
Child Abuse Fatalities by Industrialized Country and US State
Child fatalities from abuse is more prevalent in the US than in other industrialized nations and there is significant variation state by state.


Source: BBC News Article, October 17, 2011 "America's child death shame"
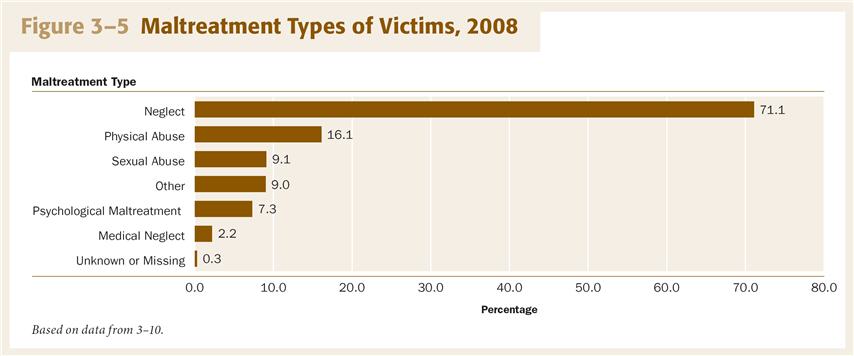
Child Neglect
Child neglect is by far the most common form of child abuse recorded in the US, accounting for 71% of reported cases in 2008:
Source: US Department of Health and Human Services Child Maltreatment Report 2008
The answer may surprise you. It is most commonly not the proverbial "stranger" that most children are warned to avoid - it is more likely to be someone much closer to home:

Source: US Department of Health and Human Services Child Maltreatment Report 2001
Child Abduction Statistics
Definition:
Child Abduction - Child Abduction is a serious, yet common occurrence when people who suffer from personality disorders become involved in a custody dispute. Approximately 82% of more than 200,000 child abductions every year are perpetrated by family members.
Description:
U.S. Department of Justice statistics show that 9% of reported missing children cases are the result of child abductions and that 82% of reported child abductions in the US are determined to have been committed by family members.
| Episode Type | Reported Cases | % of Missing | % of Abductions |
| Reported Missing Children | 797,500 | 100% | |
| Runaway/Thrown Away | 357,600 | 45% | |
| Missing, Benign Explanation | 340,500 | 43% | |
| Missing involuntary, lost, injured | 61,900 | 8% | |
| Family abduction | 56,500 | 7% | 82% |
| Non family abduction | 12,100 | 2% | 18% |
| Stereotypical abduction* | 115 | 0% | 0% |
Source: US Dept. of Justice Office of Juvenile Justice & Delinquency Prevention
*Stereotypical kidnappings are the particular type of non family abduction that receives the most media attention and involves a stranger or slight acquaintance who detains the child overnight, transports the child at least 50 miles, holds the child for ransom, abducts the child with intent to keep the child permanently, or kills the child.
Family Member Child Abduction Prevalence
An estimated 203,900 children were victims of a family abduction in 1999. In 43% of these cases, the whereabouts of the abducted child was known to the child's caretaker.
| 1999 Child abductions by a family member | 203,900 | 100% |
| Whereabouts unknown to caretaker | 117,200 | 57% |
| Whereabouts known to caretaker | 86,700 | 43% |
| Abduction Reported to Authorities | 56,500 | 28% |
Source: US Dept. of Justice Office of Juvenile Justice & Delinquency Prevention
Abduction Perpetrator Statistics
In 78% of cases one of the child's parents is the abductor with abduction by the father occurring 2 times as often as abduction by the mother. However, it should be noted that in disputed custody cases, the child's mother is 7 times more likely to be granted sole custody than the child's father, which heavily influences the numbers.
| Perpetrator Relationship to Child | ||
| Child’s father | 108,700 | 53% |
| Child’s mother | 50,500 | 25% |
| Child’s grandfather | 13,700 | 7% |
| Child’s grandmother | 13,400 | 7% |
| Child’s uncle | 6,000 | 3% |
| Child’s stepfather | 3,300 | 2% |
| Child’s mother’s boyfriend | 3,200 | 2% |
| Child’s sister | 1,900 | 1% |
| Child’s aunt | 3,000 | 1% |
| Total | 203,900 | 100% |
Source: US Dept. of Justice Office of Juvenile Justice & Delinquency Prevention
Abduction Duration
In most cases, family child abductions are short-lived and will not serve the abductor well. Most courts look unfavorably on anyone who abducts children or tries to deny another parent access in that way.
| Abduction Duration | ||
| Less than 1 hour | 6,300 | 3% |
| 1-6 hours | 33,600 | 16% |
| 7-24 hours | 7,500 | 4% |
| 1-7 days | 46,600 | 23% |
| 1 week - 1 month | 48,000 | 24% |
| 1-6 months | 29,700 | 15% |
| More than 6 months | 12,400 | 6% |
| Located but not returned | 12,700 | 6% |
| No information | 7,100 | 3% |
| Total | 203,900 | 100% |
Source: US Dept. of Justice Office of Juvenile Justice & Delinquency Prevention
If a former spouse or family member disappears with the children, it is best to contact the local authorities immediately for help. See our Emergency Page for More Info.
Elder Abuse & Neglect Statistics
Elder Neglect Prevalence
U. S. Administration on Aging, National estimates of the incidence of abuse, neglect, and self-neglect of persons 60 years and older, 1996 are as follows:
| Type | Estimated Incidences |
|---|---|
| Abuse | 402,287 |
| Neglect/Abandonment | 182,368 |
| Self-Neglect | 138,980 |
Elder Abuser Relationship to Victim
Relationship of perpetrators to victims of domestic elder abuse:

Relationship of perpetrators to victims of domestic elder abuse for selected types of maltreatment:
| Neglect | Emotional/ Psychological | Physical | Financial/ Material | Abandonment | |
| Child | 43.2% | 53.9% | 48.6% | 60.4% | 79.5% |
| Sibling | 8.7% | 1.8% | 4.7% | 1.3% | 0.0% |
| Grandchild | 8.8% | 8.9% | 5.6% | 9.2% | 6.6% |
| Parent | 0.5% | 0.0% | 0.8% | 0.0% | 0.0% |
| Spouse | 30.3% | 12.6% | 23.4% | 4.9% | 6.4% |
| Other relative | 3.7% | 11.7% | 5.4% | 9.7% | 0.0% |
| Friend/ neighbor | 0.6% | 10.3% | 10.2% | 8.7% | 0.0% |
| In-home service provider | 4.2% | 0.9% | 0.2% | 1.7% | 7.4% |
| Out-of-home service provider | 0.0% | 0.0% | 1.2% | 4.1% | 0.0% |
| Percentage of total perpetrators | 47.8% | 36.1% | 26.9% | 30.4% | 4.2% |
Divorce Statistics
US Marriage and Divorce Rate:
| Year | US Population | Marriage Rate per 1,000 population* | Divorce Rate per 1,000 population* |
|---|---|---|---|
| 2009 | 306,803,000 | 6.8 | 3.5 |
| 2008 | 304,483,000 | 7.1 | 3.5 |
| 2007 | 302,226,000 | 7.3 | 3.6 |
| 2006 | 299,398,484 | 7.4 | 3.7 |
| 2005 | 296,497,000 | 7.6 | 3.6 |
| 2004 | 293,623,000 | 7.8 | 3.7 |
| 2003 | 291,384,000 | 7.7 | 3.8 |
| 2002 | 288,369,000 | 7.9 | 3.9 |
| 2001 | 285,318,000 | 8.2 | 4.0 |
| 2000 | 281,422,000 | 8.2 | 4.0 |
Source: CDC/NCHS National Vital Statistics System. *Excludes some states.
Percentage of New Marriages which End in Divorce, in Selected Countries (2002):
| Country | Divorces as a Percentage of Marriages |
| Sweden | 54.9 |
| Belarus | 52.9 |
| Finland | 51.2 |
| Luxembourg | 47.4 |
| Estonia | 46.7 |
| Australia | 46 |
| United States | 45.8 |
| Denmark | 44.5 |
| Belgium | 44 |
| Austria | 43.4 |
| Czech Republic | 43.3 |
| Russia | 43.3 |
| United Kingdom | 42.6 |
| Norway | 40.4 |
| Ukraine | 40 |
| Iceland | 39.5 |
| Germany | 39.4 |
| Lithuania | 38.9 |
| France | 38.3 |
| Netherlands | 38.3 |
| Hungary | 37.5 |
| Canada | 37 |
| Latvia | 34.4 |
| Moldova | 28.1 |
| Slovakia | 26.9 |
| Portugal | 26.2 |
| Switzerland | 25.5 |
| Bulgaria | 21.1 |
| Slovenia | 20.7 |
| Romania | 19.1 |
| Poland | 17.2 |
| Singapore | 17.2 |
| Greece | 15.7 |
| Croatia | 15.5 |
| Spain | 15.2 |
| Israel | 14.8 |
| Albania | 10.9 |
| Azerbaijan | 10.3 |
| Italy | 10 |
| Georgia | 6.6 |
| Armenia | 6 |
| Turkey | 6 |
| Bosnia and Herzegovina | 5 |
| Macedonia | 5 |
| Sri Lanka | 1.5 |
| India | 1.1 |
Source: http://www.divorcereform.org.
Many people believe that mothers are naturally better caregivers than fathers. And the US courts seem to agree. US Divorce Statistics show that a divorcing mother is 7 times more likely to retain sole custody of her children than a father:
| USA 1990 Custody Statistics (19 States reporting) | Percentage |
|---|---|
| Sole possession granted to mother | 72.5% |
| Sole possession granted to father | 10.3% |
| Joint possession | 15.7% |
| Possession granted to other person(s) | 1.4% |
Source: http://www.divorcepeers.com/stats17.htm
Fathers, who want to protect their children from an abusive mother, are sometimes afraid to take legal action because they fear:
When it comes to child support, US census data indicates that:
US census data also indicates that fathers are more likely to fulfil their child support obligations than mothers:
One of the reasons that "deadbeat dads" get most of the bad press in the popular media is that there are a lot more of them - primarily for 2 reasons:
Source: 2002 Fox News Article